The Impact of Migration on Education
8 October, 2010
Contents:- Overview
- Migrants and education in the UK: –1998-2009
- Projected impacts: next 10 and 25 years
- Pressures on school places
- Sources of data
- Methodology
- We estimate that in twelve years since immigration began to climb rapidly under the previous government (1998 – 2009), the additional public spending required for the education of the schoolchildren of migrants was almost £16 billion. Of this almost £5 billion was in 2009 alone; this amounted to over £13 million a day and was equivalent to over 1p on the basic rate of income tax.
- Over the next five years – to 2016 – 550,000 more school places will be needed as a direct and indirect result of migration, costing a further £40 billion, and over the next ten years – to 2020 – this rises to one million extra places at a total cost over ten years of almost £100 billion.
- Looking further ahead, the official population projections, suggest that an additional 2.3 million births between 2008 and 2033 will result from migration. Adding direct migration to this and assuming that all of the additional children are educated in state schools, the total costs of their schooling would be almost £195 billion over a 25 year period. This calculation is made using very conservative assumptions about school leaving age etc., it does not make any allowance for additional education requirements of migrants (eg: help with languages etc.) so the eventual cost could be much higher than this.
- By 2033 children born earlier in the period will have left school so the number of additional school places required will be about 1.3 million. This would be equivalent to almost 3,800 new schools staffed by around 75,000 additional teachers.
1. Overview
Education is one of the most important public services provided by government, representing a major spending commitment, in 2009-10 costing in the UK – England, Wales, Scotland and Northern Ireland - over £88 billion in total, of which three-quarters is specifically for pre-primary, primary and secondary education. Full time education in England is compulsory for all children between the ages of 5 and 16. Approximately 93 per cent of children are educated in local education authority -run schools financed by national taxation. The remaining 7 per cent are educated in private fee-paying schools or at home.
2. Migrants and Education in the UK: 1994 - 2008
The impact that migrants have on the demand for education is determined by two variables:
- Numbers of net migrants of school age entering the UK, and
- Numbers of births to migrant parents who were born outside the UK
Data for the first of these – the ‘direct’ impact of immigration - is available from the ONS ‘Long Term International Migration’ (LTIM) database. Data for the second is available from ONS birth data. Children born in the UK to parents both of whom were born abroad are counted as an indirect consequence of migration. Where only the mother was born outside the UK, the number of children born in the UK is split, with only half counted as the indirect consequence of migration. In a study in 2002 the Home Office counted all children with one UK born and one foreign born parent as dependants of a UK resident, thereby refusing to include them in the number of ‘indirect’ migrant children. This assumption has been challenged, as mentioned in the report by the Economic Affairs Committee of the House of Lords.[1] Migrationwatch argued previously that the costs to public services of children with one migrant parent should be split equally between the immigrant and the UK-born population, and this is the convention used in this paper.
The ‘direct’ impact of migration on school age children is very small compared to the ‘indirect’ impact. This is because most migrants are of working age. ONS data on school age migrants only provides the total aged 16 or under, so not all of these will require the 11 years of education mandated by law – we make the ‘guestimated’ assumption that only half will in any one year.
For children born in the UK of migrants, we assume that all will require to be educated between the ages of 5 and 16, and all in the state sector. From the data on births a cumulative total of pupils can be calculated. Added to the data for migrant children, this yields the number of additional pupils in the state education sector who are present because of net migration. Using government data on the costs per pupil, the additional costs, both ‘direct’ and ‘indirect’, of net migration on the education system over the period 1998– 2008 can be calculated.
This estimate is subject to a number of caveats:
- It disregards all impacts arising from migration before 1998, although these are of course not insignificant
- It does not make allowance for the significant additional costs of educating children of migrants – for example, the Government’s ‘Ethnic Minority Achievement Grant’, intended to provide additional finance for areas with special educational needs as a result of migration (eg: extra help with languages etc): in 2010-11, £206.6 million was allocated for this programme.
- It makes no allowance for the death of UK born children to migrant parents.
Table 1 gives data on total births in England and Wales broken down by country of birth of the mother, and net international migration of school age people over the period 1998 – 2008. To summarize the data in the table, between 1998 and 2009:
- Total births increased by 11.1 %
- Births to women born in the UK fell by 3.2 %
- Births to women and fathers born outside the UK more than doubled, increasing by 134.2 %
- In 1994, 14 % of all births were to women born abroad, and by 2009 the proportion had almost doubled to 25 %
Table 1: BIRTHS TO UK, NON-UK BORN WOMEN, NON-UK BORN WOMEN AND FATHERS: 1998 – 2009. IMMIGRATION (NET) OF SCHOOL AGE CHILDREN

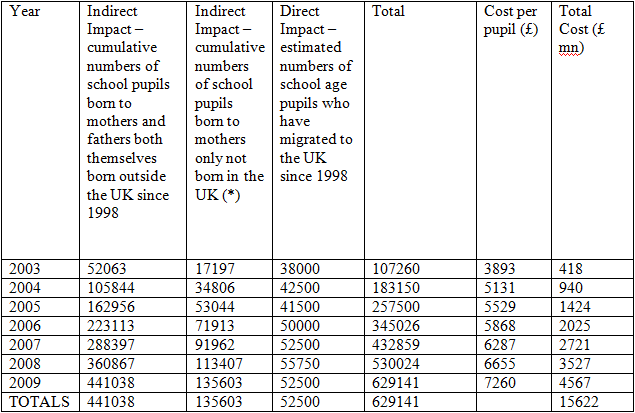
Table 2 translates the data in the previous table into actual pupil numbers and school places required, arising either directly or indirectly from immigration. Starting in 1998– and ignoring any migration impacts occurring in previous years – the total cumulative addition to school pupil numbers by 2009 is around 630,000 – in that year costing almost five billion pounds (£5 billion) in terms of additional public spending on education. This underestimates the actual cost because it excludes additional public spending costs occurring as a result of the special educational requirements of some communities.
Table 2 : ADDITIONS TO SCHOOL POPULATION ARISING FROM NET INTERNATIONAL MIGRATION –1998– 2008

* absolute numbers are split 50:50 on the assumption that only half of such children should be counted as being a consequence of migration.
3. Projected impacts: next ten and twenty five years
It is of interest to understand what the likely impact of immigration might be on future pupil numbers, school places and educational costs.
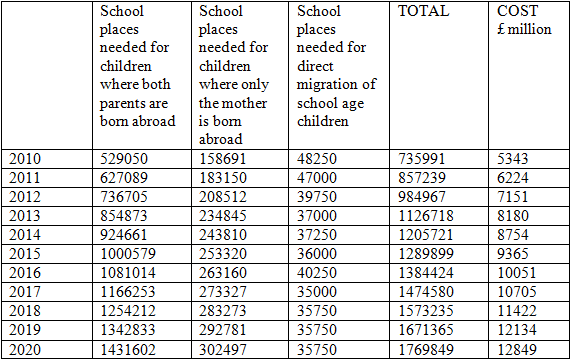
Over the next 10 years – to 2020 – one million more school places will be needed because of migration – overwhelmingly because of births in the UK to parents born abroad. Based on costs per pupil in 2009, the cost of these additional school places would be almost £100 billion over the ten year period. (Section 6 of this paper below explains the methodology for this calculation).
Table 3: PROJECTED SCHOOL PLACE REQUIREMENTS AND COSTS: 2010 – 2020

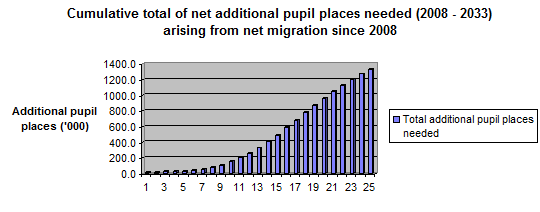
In the longer term, the ‘principal projection’ by ONS of UK population over the period 2008 – 2033, projects a total of births of 19.8 million, of which 2.3 million are projected to occur, directly or indirectly, because of net migration. It also projects a net inflow of around 4.6 million migrants, of whom around 4 % - 6,500 a year, or 162,500 over the 25 years of the projection - are assumed to be children under 15. Not all of these migrants, who will be of different ages, will require education for the full mandatory 11 years, so it is assumed for the purposes of this exercise that half will (the same assumption as made above). Adding half of 162,500 to 2.343 million and assuming that pupils stay at school for no longer than the mandatory 11 years, the number of additional ‘pupil-years’ is 11 x (2.343+0.1625/2) or 26.68 million. Assuming that the cost of educating each pupil remains the same in real terms as in 2009- 10, the total cost of educating these children would be almost £195 billion over 25 years, or almost £8 billion a year. It is important to understand that this is an additional cost to the previously mentioned annual cost of £5 billion for 2009 because it is a count of the additional costs caused by migration in 2008 and then for the next 25 years. Also, the assumptions that underlie this calculation are very cautious and conservative – for example, it is assumed throughout the 25 year period that the school leaving age is not raised (it almost certainly will - the previous Government proposed before leaving office to raise the school leaving age to 18 by 2013) And that pupils stay at school for the minimum period mandated by law.
The need for additional school place requirements is not the same as the increases in pupil numbers: it depends on the time-scale over which pupil numbers increase, the length of the statutory requirement for schooling, and the length of the projection period. School place requirements over a 25 year period would be less than the additional pupil numbers projected if it is assumed – as we do in this calculation – that the mandatory period of education will continue to be 11 years as now. Also, over a 25 year projection of births, since children are assumed to start education at age 5, the additional school places required as a result of births is calculated for a 20 year period because in the first five years of the projection period there will clearly be no requirement for any additional children born to be educated.
Taking all these considerations into account, we have calculated that the total additional number of school places needed to 2033 will be 1.3 million. If all these new places were to be provided by building new schools, this would necessitate up to an additional 3,800 schools (both primary and secondary). Around 75,000 additional teachers would be needed.

4. Current pressures on school places
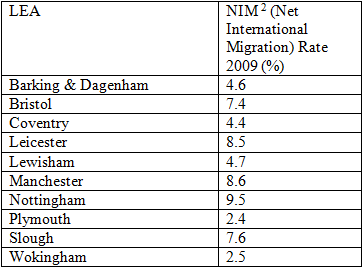
Total pupil numbers in schools in the UK fell by some 4 per cent in the ten years to 2009, reflecting the falling trend in overall births between 1998 and 2002. However, there is a growing body of evidence indicating the impact that migration, and an increased birth rate arising as an indirect consequence of this, are having on school places in certain areas of the UK. The data at local education authority level is sometimes anecdotal but it does suggest that in areas that have experienced high levels of net migration, pressure on school places is high and increasing. A recent article in the Daily Telegraph noted that pressures on school places in some areas of England were acute and likely to increase in future, due to increased births and migration. Virtually all of those education authorities specifically mentioned in the Telegraph’s article have experienced high rates of immigration in recent years. The average NIM[2] rate of the authorities in the table below is 6 per cent – over three times the average for England & Wales as a whole (2 per cent):
Table 3: Education Authorities reported as experiencing pressures on school places

Below is further evidence from Birmingham, London and Peterborough:
- Peterborough – NIM rate of 6.3 % (with a net inflow of over 10,000 migrants over the same period) – The ‘Daily Telegraph’ reported that in Peterborough ‘every class in every year group is already full and it (the City Council) has ‘struggled to find places for all 2438 pupils due to start reception classes next month’….’the population has risen from 165,000 to 185,000 in six years due mainly to immigrants looking for work….Immigrant communities account for 64 per cent of Peterborough’s population growth’
[14/08/2010]
- London – NIM rate of 5.2% A report has been published by London Councils which argues:
"Councils in London are facing extraordinary demand for reception places in local primary schools. Very few boroughs have surplus school places and some have little or no capacity to offer reception places to new primary pupils. This additional demand, which affects three quarters of Boroughs in the capital, is expected to continue for the foreseeable future. London’s primary schools need to be expanded and new schools need to be built to ensure that there are sufficient places for five year-olds. However, the level of government funding available to build additional classrooms and schools to match the unprecedented demand for places in London is simply inadequate".
"For this financial year ending in March 2010, just over 2,250 children in London will be without a reception place and councils are being forced to consider a range of temporary measures to ensure education provision is made for these children. The shortfall in reception places is expected to increase to over 5,000 children up to the end of the current spending review period in March 2011. Based on current Borough projections, London faces reception place shortfalls of more than 18,300 in total by 2014".
It was noted that the rising birth rate in London had contributed to the huge increase in numbers of school age children, especially compared to rates in other parts of the country. Since 2001/02 the birth rate in London has grown by an extraordinary 20.5 per cent - the fastest rate of growth of any English region. This is significantly higher than the national growth rate over the same period of 16.8 per cent.
Increasing birth rates have an even greater impact at local level. Between 2001 and 2007, Barking & Dagenham experienced a birth rate increase of 40 per cent, Greenwich 36 per cent, Hounslow 29 per cent and Sutton 28 per cent.
http://www.londoncouncils.gov.uk/localgovernmentfinance/publications/dothemaths.htm
- Birmingham – NIM rate of 3.9%, 39,900 net migrants 2003 – 2009 – ‘the growing birth rate meant Birmingham would have a shortfall of 3000 reception places between now and 2020…..due to high birth rate……..”Biggest baby boom in Birmingham since the 1960s. The report estimates that one inner city area of Birmingham will see 1999 birth rates jump by 48 per cent by 2018. The report entitled ‘shortage of Primary School Places’ added: "there was a 14 % fall in the birth rate between 1991 and 2001. Between 2001 and 2008 there has been a dramatic increase of 21.5%
See also:
http://www.slough.gov.uk/moderngov/(S(qxgzge554gzceqezoi131345]/mgAi.aspx?ID=16024
http://www.timesonline.co.uk/tol/life_and_style/education/article6701273.ece
5. Data Sources
Births:
http://www.statistics.gov.uk/downloads/theme_population/FM1-37/FM1_37_2008.pdf
Education costs:
http://www.hm-treasury.gov.uk/pespub_index.htm
Pupil and school numbers:
http://www.statistics.gov.uk/statbase/product.asp?vlnk=94
2009 ONS Population projection:
http://www.statistics.gov.uk/cci/nugget.asp?id=1352
6. Methodology
The calculations of pupil numbers, ‘pupil-years’, school place requirements, and additional schools and teachers needed are underpinned by the following assumptions:
- Children start school at 5 and leave when they are 16
- Average pupil – teacher ratios remain the same as in 2008/09 for the whole of the UK: 20.7 for primary schools and 15.4 in secondary schools
- Average primary and secondary school sizes remain the same as in 2008/09
- Half of the children born in the UK to mothers who were born abroad are counted as children of migrants
- Half of all children under 16 who migrate to the UK directly are assumed to require schooling for the whole of the minimum statutory period (11 years)
- There are no deaths of such children
- Data on births of children to non-UK born mothers (and non-UK born fathers) for the period 2010 – 2015 are projected using the trend rate of such births in the period 2000 – 2009
- Costs include both revenue and capital spending per pupil and exclude any additional costs incurred in educating children whose mother tongue may not be English
Pupil places are calculated from 1994 to 2020 and then from 2008 to 2033, to illustrate the impact that immigration is having now, and then over the next 10 years, on school place requirements, and then to look at the additional impact that migration is likely to have over the 25 year period of the government’s population projection.
The total of pupil places is a net cumulative figure – that is, it is calculated as a moving total, which changes each year as the total of pupils born 16 years beforehand is subtracted whilst the total of children born 5 years previously is added. In addition, the cumulative total number of children (adjusted as above) who have themselves directly migrated to the UK are added for each year, and after 11 years each year’s total of migrants is subtracted.
Footnotes
- House of Lords Select Committee on Economic Affairs HL paper 82-1 April 2008.
- NIM is the rate of Net International Migration: it is calculated by totalling net numbers of international migrants into an area in the period 2003 to 2009, and then expressing the resulting total as a percentage share of the population of the area in 2009. The NIM rate essentially measures the ‘intensity’ of net international migration into an area.
