Future Migration Flows from Eastern Europe
1 August, 2008
Summary1. The recent fall in the number of migrants arriving from Eastern European members of the EU has led to suggestions that the immigration problem is on the way to solution. That is far from the case. This paper confirms that Eastern European immigration is likely to come approximately into balance in three or four years. However most immigration is from non EU countries; these are countries from which immigration could be restricted if it were government policy to do so.
How many have come?
2. It is difficult to estimate the true extent of net immigration from Eastern Europe since 2004. The coverage of the International passenger Survey (IPS) has not covered all the points of arrival. Furthermore, it asks questions, on a voluntary basis, about intentions. It is quite possible that intentions will change, especially as freedom of movement within the EU encourages people to come to the UK on a 'trial' basis. In the 12 months to June 2008 only 11% of registered workers said they would stay for a year or more but this seems a very low figure.
3. The Workers Registration Scheme records arrivals but, anecdotally, a significant number are unwilling to pay the £90 registration fee. Nor does it include the self employed, nor dependants who arrive after initial registration. Critically, it gives no information about departures.
4. An alternative would be to look at the Labour Force Survey to see what proportion the rise in the stock of A8/A2 nationals is of the rise in all foreign nationals between Q1 2004 and Q42007. This yields 45% or roughly one in two. However, it would be wrong to compare stocks of foreign nationals because non-EU nationals become British citizens and EU nationals generally don't. So, if you compare stock, much of the inflow of new non-EU migrants would be offset by the reduction in existing non-EU foreign national caused by these nationals becoming British citizens. For example, in 2007- 5,880 EEA citizens were given nationality compared with 158,775 non-EEA citizens; the stock of foreign citizens would be reduced accordingly.
5. According to the official (IPS ) figures, net East European migration between 2004-2006 totalled 181,000 out of total net foreign immigration of 960,000 =19% or for 2006 alone it was 71,000 out of 316,000 = 22%. This may be an underestimate for the reasons given above. A further approach would be to take unofficial estimates (by the IPPR) that half have gone home, leaving 500,000 still in the UK; dividing this by four gives 125,000 a year. In 2006 the IPS figure was only 71,000 so 54,000 should be added to net foreign immigration, bringing it to 370,000. This suggests that Eastern European immigration has accounted for about one third of net foreign immigration since 2004.How many will come in future?
6. Net migration flows into the UK from the countries which acceded to the EU in May 2004 (the A8 countries) will be a factor of:
- The levels of gross immigration flows
- The length of time migrants remain in the UK.
7. Both of these factors will in turn be largely driven by the following:
- The relative economic levels of the UK and the Eastern European economies
- Unemployment levels, especially in the East European countries
- Demographics
- The policy of other EU countries towards the admission of east European workers
These factors are discussed in more detail below.
Economic levels of UK and Eastern European economies8. The following graph plots the number of workers who have registered on the UK Workers Registration Scheme per head of population against the GDP per head (in dollars) for the eight Eastern European countries which joined the EU in May 2004. This shows that GDP is a major determinant of the rates of migration to the UK:
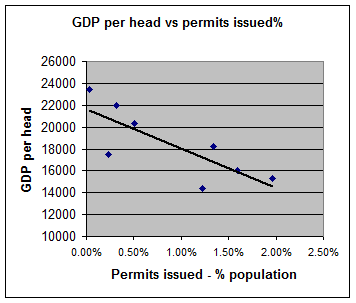
9. The four countries which have the highest registration rates are Poland, Slovakia, Latvia and Lithuania (in ascending order). Poland, which is the source of the highest number of registrations overall, has an estimated GDP per head (on a purchasing power parity basis) of $14,400 compared with the UK’s $31,800. Its growth rate in 2006 was 6.1% compared with the UK’s 2.8%. It can expect to continue to witness rapid economic growth resulting from the introduction of a free market economy, the benefits of being part of the EU free trade area and substantial funding from the EU. Assuming that Poland continues to grow at a rate of say 2.5% above the UK rate it would take about 12 years for Poland’s GDP per head to reach a level (of $19,000) at which migration rates may be expected to halve (based on the above trend line).
10. The effect of a rising GDP on emigration has already been seen with Portugal and Greece. They have GDP’s per capita of $19,800 and $24,000 respectively, well below the UK’s level of $31,800 but sufficiently high to have resulted in low levels of net migration to the UK from these countries.
Unemployment11. Clearly unemployment in Eastern Europe could be a driver of emigration from these countries. In 2006 the unemployment rate in Poland was 14.9%. It is now about 10% as the economy grows and as the number of workers in Poland is reduced by emigration. Unemployment is therefore unlikely to be such a strong driver of emigration as it has been in the past. However, graduate unemployment could remain high.
Demographics
12. 82% of all the registered workers from May 2004 to June 2008 from the A8 countries were in the age group 18-34. The age profile of registered workers has remained remarkably consistent with just a very slightly lower percentage (79%) of 18-34 year olds registering in Q2 2008. It is likely that, after over 4 years of access to the UK labour market a large percentage of those who are likely to come to the UK will already have decided to do so. Most of this population will also have had friends and family who have moved to the UK and will have provided feedback which will have helped to crystallise decisions as to whether to move to the UK.
13. The number of young people who are reaching an age at which they might decide to move to the UK is rapidly declining. In Poland, for instance, the population of 18 year olds will fall from 600,000 in 2005 to 400,000 in 2016[1].
EU policies
14. Nine countries of the EU have now opened their labour markets to the A8. The other 6, notably France, Germany and Austria must open their labour markets from May 2011 at the latest. It is likely that this will cause some reduction in the number of East Europeans seeking work in the UK. However, the UK may remain the preferred destination for most Poles because of English being the preferred language in the Polish educational system and because of the strong ties which will exist with the UK as a result of the high numbers of Poles already here.
The likely number of arrivals
15. It is impossible to be sure but it seems likely that the combination of the economic and demographic factors sketched out above and the full opening of EU labour markets will lead to a significant fall in migration from the A8 countries to the UK. Our guess is that the number of workers from the A8 registering to work in the UK will follow the pattern below.
Number of registered workers |
|||||||
2004 |
2005 |
2006 |
2007 |
2008 |
2009 |
2010 |
2011 and onwards |
126000 |
205000 |
228000 |
211,000 |
160000 |
120000 |
80000 |
50000 |
Length of stay of migrant workers
16. Both the official migration statistics and the workers registration scheme (WRS) statistics point to the majority of A8 migrants staying for only a short period of time. Answers given under the WRS suggest that 61% of workers will stay for less than 3 months with a further 9% staying for up to 2 years. Only 7% said they intended to stay for more than 2 years with 24% saying they did not know.
17. Anecdotal evidence would suggest that a much greater percentage than this are in fact staying in the UK. This was supported by a survey carried out by ARC Market and Opinion, a Warsaw based market research firm, which found that only 45% of Poles surveyed planned to go home within 4 years. A further 45% said that they would stay at least 5 years and 10% said they would settle in Britain for good.
18. We have used this survey as the basis of our calculation but have also assumed that:
- A significant proportion of those who plan to leave in the first four years will be seasonal workers and will leave within a year of arriving in Britain.
- Many of those who stay for 10 years or more will remain in the UK permanently even if this is not their intention initially.
19. This leads to the following assumptions regarding rate at which East Europeans will leave the UK:
- 25% in the year of arrival
- 5% in each of years 1 to 4 inclusive.
- 4% in each of years 5 to 9 inclusive.
This makes a total of 65% who will leave within 10 years of arriving in the UK with the remaining 35% staying permanently.
Probable net immigration20. The following graph shows the likely inflows and outflows of A8 citizens using the assumptions about inflows and lengths of stay described above. For the number of arrivals we have used the numbers of actual and projected registered workers in paragraph 10 and added 20% to it as an estimate of the number of self-employed workers (who do not have to register on the WRS) and a further 25% to the combined total to allow for dependants. (The latter figure is higher than the number of dependants recorded in the WRS which was just 7% in 2004 increasing to 17% in Q2 2008. Our figure of 25% allows for dependants joining after the registered worker has become established in the UK).
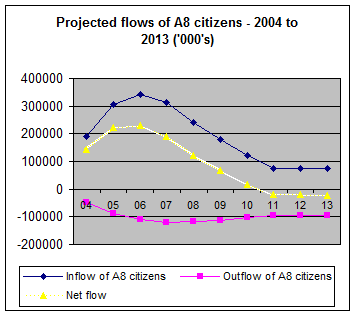
21. As can be seen from the above this would point to net migration flows of A8 citizens into and out of the UK being brought broadly into balance from 2010 with a small net outflow in the following 3 years. Any outflow would probably be offset, in time, by an inflow from Romania and Bulgaria which will enjoy full access to the UK labour market from January 2014. Inflows from these two countries are, however, likely to be relatively low because other countries have opened their labour markets to them before the UK and the two countries will have full labour market access to all EU countries in 2014. Anecdotal evidence also suggests that southern European nations are the preferred destination of migrants from these countries.
Footnotes
- Eurostat 2004 medium variant
- Eurostat 2004 medium variant