Migration; its present and future scale
30 July, 2002
Summary
1. On current trends we can now expect a net inflow to Britain of at least 2 million non EU citizens per decade. On present patterns, two-thirds will settle in London and the South East.
Introduction
2. This paper examines the facts, drawing on publications from the Home Office and the Office for National Statistics (ONS). It deals first with legal migration, then illegal immigrants. It concludes with an estimate of the total.
Legal Migration
3.All measures are approximate because of the scale and complexity of migration flows. However, legal migration can be estimated in three ways - on arrival, on acceptance and by projection:
(a) On arrival
The International Passenger Survey asks a small sample of incoming and outgoing travellers whether they intend to stay in (or leave) Britain for more than twelve months. Those who do so intend are classed as migrants and the numbers are grossed up by the Office for National Statistics (ONS) to provide an estimate. The figures are adjusted to take account of migration to and from the Irish Republic, asylum seekers and those who legally change their status while here, for example by marriage. This estimate is rough and, because it is the difference between two large numbers, it can fluctuate.
It would be wrong, therefore, to attach undue significance to the total for a particular year.
In 2000, the last year for which data are available, net inward migration was estimated at just over 183,000 persons. The average net inflow over the three year period 1998-2000 was 180,000 (i) per year, double the average annual levels in 1990-94.
(b) On Acceptance for Settlement
This is the number of people formally granted the right to settle in Britain by the Home Office.
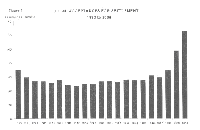
The total is less than the International Passenger Survey figure because some categories have to wait one or several years before qualifying, some are subject to administrative delays and some later depart. EU citizens do not need such permission. In the year 2000 the number accepted for settlement was 125,000. This was more than double the average for 1990-94 which was 54,000 (ii).
 Click here to view
larger version
(c) Projections
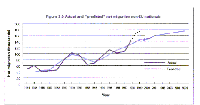
A recent projection was produced by the Home Office Research Department but only up to 2005. They fitted a curve to the trends of the last fifteen years using a method based on previous migration and on UK unemployment. The projection shows a continuing upward trend reaching 180,000 in 2005 and still rising(iii).
 Click here to view
larger version
The dotted line at 1 in Figure 3.5 shows actual numbers for 1999 and 2000 of 174,000 and 176,000 issued subsequently and added to the graph by MigrationwatchUK
The Office for National Statistics also produce a projection which, historically, has lagged well behind the actual numbers. It is used
for the national population projections. The latest, produced in 2000, was for 135,000 every year (iv) which the Treasury clearly regard as an underestimate.
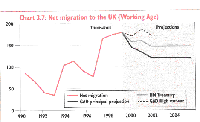
In "Prospects for trend growth" issued with the 2002 budget they published the following chart. Unlike the other two projections above, it includes EU nationals but it excludes dependants and only applies to migrants of working age. It is, however, further evidence of the substantial scale of legal migration which can now be expected.
 Click here to view
larger version
Illegal immigrants and illegal overstayers
4.There are three very broad categories:
(a) Asylum seekers who overstay
Analysis of Home Office statistics over the past 10 years shows that just under 10 per cent are granted asylum, 17 per cent are granted exceptional leave to remain, and 12 percent are removed (v). The other 60 per cent disappear amounting, at present rates, to 50 to 60,000 per year.
The adjusted ONS figures at para 3(a) take account of these.
(b) Other overstayers
Large numbers come to Britain entirely legally as visitors, students etc. In the year 2000, Britain admitted about 2.5 million visitors (including 140,000 students) from the third world and 1.1 million from Eastern Europe (including 70,000 students) (vi) . Some are subsequently accepted for settlement by reason of marriage etc. They are included in the official figures at 3(b). But others stay on and enter the illegal work force. Since the mid-Nineties there has been no recording of departures at British ports and airports so there is no means of knowing how many stayed on illegally. Even the most conservative estimate of 1% would amount to 35,000; the number could be much higher.
(c) Undetected immigrants
A significant number of people are smuggled into Britain undetected. According to the Home Office, some 75 per cent of them are believed to be smuggled by gangs. In the year 2000 about 47,000 were detected (vii) . Half this number rounded to 25,000 per year would be a very low estimate for those undetected since, at Dover for example, only one truck in 100 is searched.
The total flow
5. Recent actual official data from the Office for National Statistics (ONS) on net inflows from outside the EU points to an annual net inflow of about 180,000, at least twice the flow during the years 1980 to 1995. The Home Office projection at para 3 (c) above also point to an annual net inflow of about that figure.
6. This figure, however, takes no account of overstayers or clandestine entrants for which there are no official estimates. The Home Office believe that 500,000 illegal immigrants enter the European Union undetected every year (viii). Of those who seek asylum in the EU, a quarter come to Britain. If undetected immigrants follow the same pattern about 125,000 would come to Britain every year. Nevertheless, we are taking much lower estimates of 35,000 and 25,000 per year for these two undetected categories.
7. Actual known official figures for net immigration together with an allowance for undetected immigrants as suggested in paras 4 (b) and 4 (c) above gives about 240,000 per year , that is more than 2 million every decade if these levels persist.
The outlook
8. Migration varies from year to year but the long term trend has been upwards. There is no sign
of any significant reduction in the flow. The last three years have maintained a record level of about 180,000 per year. A recent Home Office paper remarked that:
"While there may be some decline from the unusually high net migration levels of the last few years, the long term trend is likely to be increasing for at least the medium term. Moreover, we know that higher migration flows are likely to be persistent: both because migrants acquire legal rights around family reunion, and because of chain migration effects."(ix)
9.One of the major "pull factors" identified by the Home Affairs Committee of the House of Commons was the existence of communities already here (x) . As these communities expand, so will their attractiveness to their fellow nationals increase. Nor is there any shortage of potential immigrants. The total population of the 10 countries which are the main sources of asylum-seekers amounts to 1.3 billion.
10.Another major attraction is the scope for illegal employment. The government is seeking to reduce this. An eventual economic downturn would also reduce the opportunities for such employment but the financial incentive to come to Britain will always be very strong. For example, wages for unskilled labour in India are rather less than 20p an hour.
11.Changes to the marriage regulations introduced by the present government in 1997 amount to an open ended commitment to secondary immigration which cannot be quantified. It is now possible for anyone who has been accepted for settlement to bring in a spouse or fiancé(e) even if the marriage is arranged and even if it is arranged for the purpose of avoiding immigration control. The number of spouses admitted is already showing a significant upward trend (xi)
Conclusion
12. There are no official estimates of illegal immigration into Britain. Indeed, the failure to record departures and the very limited search of vehicles entering our ports makes this flow very hard to quantify. In this paper we have chosen very low estimates to avoid any suggestion of exaggeration.
13.Unless far more effective measures are adopted, we can expect an inflow from outside the EU of 2 million people per decade for the indefinite future (and probably more depending on what estimate is taken for illegal immigration). On the present pattern, 13 % of those accepted for settlement will be from Eastern Europe and North America and 87% from the rest of the world. Illegal immigrants will be largely from the third world and Eastern Europe. More than two thirds of new migrants are settling in London and the South East. (xii)
Footnotes
| [i] | Control of Immigration: Statistics UK 2000 page 25 and table 9.1 |
| [ii] | Ibid table 6.3 |
| [iii] | RDS Occasional Paper No 67 Figure 3.5 |
| [iv] | UK population trends No 107 Spring 2000. Projections for the UK. |
| [v] | Control of Immigration: Statistics UK 2000 Table 4.1 |
| [vi] | Ibid Table 3.2 |
| [vii] | White Paper Para5.3 |
| [viii] | The Times 30 April 2002 Michael Gove quoting the Home Office |
| [ix] | RDS Occasional Paper No 67 Para 3.18 |
| [x] | Home Affairs Committee Border controls Para 10 |
| [xi] | Control of Immigration: Statistics UK 2000 Figure 12 |
| [xii] | Ibid Table 6.1 12 RDS Occasional Paper No 67 Para 6.34 |
