Net migration and Scotland’s population in the run-up to the EU referendum

13 June, 2016
Summary
1. It is sometimes suggested that the rate of overseas migration to Scotland should be increased in order to grow and rejuvenate its population. In fact, Scotland’s population has remained above five million for fifty years, and it is projected by National Records of Scotland (NRS) to grow by 7%, or 340,000, by 2039.
2. All serious studies have found that immigration is no answer to ageing populations as is the case in most Western societies as medical facilities improve. Raising the retirement age as health improves is a much better way forward.
3. About half the international migration to Scotland is from the EU. A proposal to impose work permits would cut out EU migration into lower-skilled work and reduce net international migration by about 4,000 a year. This would leave overall migration at just under 16,000 year, in line with the assumption in the NRS projection mentioned above. Such a reduction would be in line with Scottish public opinion which strongly favours a lower rate of immigration.
Scotland’s Population
4. It is often claimed that Scotland has a declining population. It did indeed decline from 1975-2002 but has fluctuated above the level of five million for the past 50 years. From 2004 onwards the Scottish population has increased by at least 0.3% a year.[1] In the space of ten years it rose by 263,000 reaching 5,350,000 in mid-2014.[2]
Figure 1: Population of Scotland, 1950-2014, Mid-year population estimates, ONS
5. Scotland’s population is projected to continue to rise, by 7% (or around 340,000) by 2039. NRS produce population projections with different migration assumptions. Their principal projection assumes positive cross-border migration from the rest of the UK at 5,000-6,000 a year and positive net international migration of 9,000 a year.[3]
Figure 2: Projected population growth in Scotland on a principal assumption of total net migration (overseas plus cross-border) of 15,000 a year - NRS, 2014-based principal projection.[4]
Age structure
6. The working age population of Scotland is projected to increase between 2012 and 2037 by four per cent and the number of children by five per cent, while the number of pensionable age is projected to increase by 27 per cent.[5] This means that Scotland’s dependency ratio[6] will increase slightly faster than that for the rest of the UK, although a representative of the National Institution for Economic and Social Research (NIESR) noted this year that the divergence is ‘quite modest’: “Currently both Scotland and the UK as a whole have about 30% of people in the age group 65 and above, relative to the 20 to 65, but in 25 years Scotland is going to have 49% while the UK as a whole has 46%.”[7] According to the LSE’s Professor Michael Murphy, over the past 150 years the departure of many young, working age people caused Scotland’s population to age. But, as he adds, ‘the population of England and Wales aged, too, at a nearly identical rate as Scotland’s’.[8]
7. An ageing population is inevitable in Western societies where birth rates are low and health care is extending lives. However, this also means that it is possible to work for longer. Raising the retirement age is one of the most effective means of decreasing the dependency ratio. Some suggest increased immigration is the answer. It is true that constant immigration has the permanent effect of moderating an ageing population but to a diminishing degree. However, as Professor Murphy argues, population size and structure must be treated separately: “Immigration is not a long-term solution for population ageing because immigrants age too.”[9]
Cross-border flows from other parts of the UK
8. Of all parts of the UK, Scotland has had the highest net internal migration (see table 1 below).[10] 39,650 people left Scotland for other parts of the UK in the year ending 2014, but 49,220 moved to Scotland, including 44,880 from England.[11] Midlothian, Aberdeenshire and East Dunbartonshire attracted the majority of internal migrants (see table 2 below). Between mid-2004 and mid-2014, more than 73,000 more people came to reside in Scotland than left as the result of cross-border migration (see Table 3 and Figure 3 below).[12] Cross-border migration has overtaken net international migration as a contributor to Scotland’s population. Since the late 1990s, population movements from the rest of the UK to Scotland have remained higher than emigration to the rest of the UK.
9. One reason for this might be that it has become financially more favourable for Scottish students to remain in Scotland for their study. The ONS speculates that the development of differing policies on university tuition fees in the different parts of the UK is likely to have had an effect.[13] There is also evidence that, as England’s population density, already one of the highest in Europe, increases and as the pressure on housing, transport, schools and the health service grows, many people are leaving England’s larger cities, especially London, and seeking to emigrate to less densely populated parts of the UK such as Scotland and Wales.[14] According to the ONS, Scotland has a higher life satisfaction score than other parts of the UK.[15] More uncertain is whether the run-up to the Scottish independence referendum in September 2014 had any impact.[16]
Table 1: Internal net migration to and from different parts of the UK as at mid-2014, ONS Annual Population Estimates
| Area of the UK | Annual internal net migration, mid-2013 to mid-2014 |
|---|---|
| England | -9,067 |
| Scotland | 9,585 |
| Wales | 165 |
| Northern Ireland | -666 |
Table 2: Top 3 local authorities affected by gains and losses due to annual net internal migration to and from Scotland as at mid-2014, ONS Annual Population Estimates
| Local authority | Internal net migration in 2014 |
|---|---|
| Aberdeenshire | 1,917 |
| Midlothian | 1,060 |
| East Dunbartonshire | 1,017 |
| Glasgow City | -1,949 |
| Aberdeen City | -553 |
| Dundee | -267 |
Net overseas migration
10. Scotland's non-UK born resident population nearly doubled between 2001 and 2011, from 3.8% to 7%.[17] By 2014, there were 173,000 residents of Scotland (3.3% of Scotland’s total population) who were born in a European Union country other than the UK.[18] Table 3 below shows that average mid-year to mid-year overseas net migration to Scotland between 2004 and 2014 was just over 15,000, while cross-border migration averaged nearly 7,300 each year. Total net migration to Scotland (comprised of overseas + cross-border migration) averaged 22,000 a year in the period.
Table 3: Net international migration and net cross-border migration to Scotland, 2004-2005 to 2013-2014, ONS Local Area Migration Indicators
| Year | Net overseas migration to Scotland | Net cross-border migration to Scotland | Total net migration to Scotland |
|---|---|---|---|
| 2004-2005 | 12,800 | 12,507 | 25,307 |
| 2005-2006 | 9,900 | 8,922 | 18,822 |
| 2006-2007 | 24,200 | 8,849 | 33,049 |
| 2007-2008 | 14,900 | 11,509 | 26,409 |
| 2008-2009 | 20,300 | 4,122 | 24,422 |
| 2009-2010 | 22,800 | 3,275 | 26,075 |
| 2010-2011 | 27,300 | 2,909 | 30,209 |
| 2011-2012 | 9,700 | 3,038 | 12,738 |
| 2012-2013 | 2,100 | 7,862 | 9,962 |
| 2013-2014 | 8,000 | 9,585 | 17,585 |
| Total | 152,000 | 72,578 | 224,578 |
| Yearly average | 15,200 | 7,300 | 22,500 |
Figure 3: Net overseas and cross-border to Scotland, 2004-2005 to 2013-2014 – ONS Local Area Migration Indicators, published August 2015
EU migration to Scotland
11. Data collated by Migration Observatory (Table 4 below) shows that just over half (52%) of the increase in the non-UK born population in Scotland between 2001 and 2011 was the result of migration by those born in other EU countries.[19] Of all non-UK nationals living in Scotland in 2014, 61% were nationals from other EU Member States.[20] ONS data suggests 66% of migrants with non-British nationality who arrived to reside in Scotland since 2004 are from the EU.[21] The EU-born population is younger than the population as a whole and just over half are concentrated in Scotland’s biggest cities, with 20.5% in Edinburgh. Since 2009, the number of people living in Scotland who were born in the accession countries has outnumbered those born in the EU14.[22]
Table 4: Analysis of census data 2001 and 2011, Migration Observatory 2013
| Census Year | Total Usual Resident Population | UK born resident population | Scottish-born resident population | Non UK-born resident population | EU-born resident population | Accession countries |
|---|---|---|---|---|---|---|
| 2001 | 5,062,011 | 4,870,440 | 4,410,400 | 191,571 | 41,836 | N/A |
| 2011 | 5,295,403 | 4,926,119 | 4,411,884 | 369,284 | 134,910 | 76,689 |
| 2001-2011 change | 233,392 | 55,679 | 1,484 | 177,713 | 93,074 |
12. Table 5 (below) shows data from the International Passenger Survey which breaks down migration data by citizenship based on a sample collected at the UK border. It suggests that average net migration to Scotland from the EU between 2005 and 2014 was 8,600 a year or about half the total.
Table 5: Net migration to Scotland by citizenship 2005-2014. International Passenger Survey
| Year | Net overseas migration (all citizenships) | Non British | Non-EU | EU | British | Proportion of net non-British migration from the EU |
|---|---|---|---|---|---|---|
| 2005 | 5,000 | 8,000 | 6,000 | 2,000 | -4,000 | 25% |
| 2006 | 10,000 | 19,000 | 11,000 | 9,000 | -9,000 | 47% |
| 2007 | 10,000 | 16,000 | 6,000 | 11,000 | -6,000 | 69% |
| 2008 | 18,000 | 17,000 | 8,000 | 9,000 | 1,000 | 53% |
| 2009 | 19,000 | 22,000 | 9,000 | 13,000 | -3,000 | 59% |
| 2010 | 27,000 | 25,000 | 12,000 | 14,000 | 2,000 | 56% |
| 2011 | 14,000 | 18,000 | 12,000 | 7,000 | -5,000 | 39% |
| 2012 | 12,000 | 18,000 | 9,000 | 9,000 | -6,000 | 50% |
| 2013 | 2,000 | 12,000 | 6,000 | 6,000 | -9,000 | 50% |
| 2014 | 10,000 | 15,000 | 9,000 | 6,000 | -6,000 | 40% |
| Annual average | 12,700 | 17,000 | 8,800 | 8,600 | -4,500 | 49% |
| Total in 10 years | 127,000 | 170,000 | 88,000 | 86,000 | -45,000 |
Figure 4: Components of net migration to Scotland by citizenship 2005-2014, International Passenger Survey
13. The annual Labour Force Survey provides an estimate of the type of jobs EU migrants are doing in Scotland by year of arrival. It suggests just under 70% of EU migrants surveyed for the quarter October to December 2015, who arrived from 2005-2015, were working in lower-skilled jobs and 30% were working in higher-skilled jobs.[23] The LFS also estimates that migrants from the Eastern European countries as well as Greece, Germany and Portugal are most likely to be in lower-skilled work in Scotland.
14. Figures from the now-discontinued Worker Registration Scheme show that A8 migrants who registered between April and June 2010 were most likely to be employed in ‘Hospitality and Catering’ (29%), ‘Administration, Business and Management Services’ 4 (25%), ‘Agriculture’ (12%) and ‘Food, Fish and Meat Processing’ (11%). According to the Scottish Government, studies conducted at local authority level have also found that ‘A8 migrants are predominantly employed at a low-skill, low-pay level, despite most having a higher skills level and/or qualification.’[24]
Projected population growth
15. As outlined in paragraph 5 above, the NSR’s principal projection estimates that Scotland’s population will increase by 0.35 million between 2014 and 2039. This is based upon an assumption of total net migration (cross-border and overseas combined) falling to 14,000 a year until 2019 and then going up to 15,000 a year. Until 2024, 57% of projected population growth is assumed to be the result of international migration and 32% the result of internal migration from other parts of the UK.[25] The projected population increase by 2039 is still expected to be greater than 16 EU countries.[26] Scotland also had higher population growth in 2015 than the EU-15 average.[27]
16. Ten per cent of Scotland’s population growth until 2024 is projected to be the result of natural increase. Natural change in the population is set to decline between 2014 and 2039 by 23,000.[28]
Figure 5: Scotland 2014-2084. Variant population projections (1000s). NRS 2014-based population Projection.
17. The ONS Statistics predict that the Scottish population will, in future, grow less rapidly than that of the UK as a whole, because Scotland will experience a lower level of net migration, a lower fertility rate and lower life expectancy.[29] But the principal population projection points to a slight increase in the number of births until 2024-2025 (a peak of 57,500).[30] Admittedly, Scotland’s total fertility rate (TFR) of 1.61 births per woman in 2013 was low by the standards of the UK (1.83) as a whole. However, in 2013 it was still higher than most (17) other EU countries, and the EU average of 1.55.[31] The fundamental reasons for total fertility being so relatively low, and the death rate so relatively high merit further study.
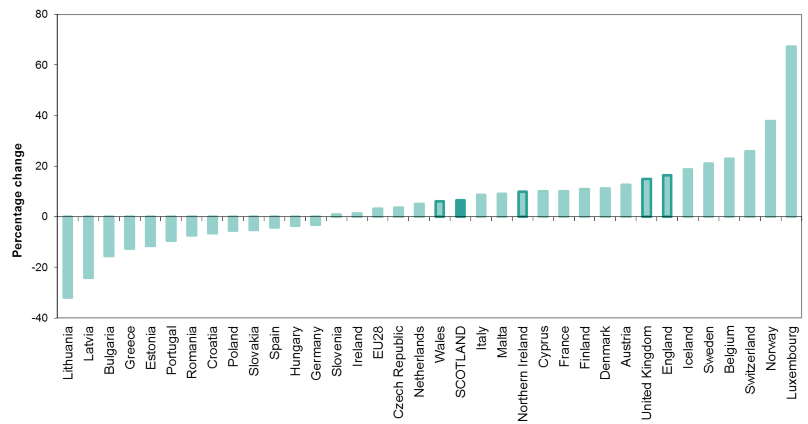
Figure 6: Projected percentage population change in selected European countries, 2014-2039, NRS, 2014-based population projection.
Proposed post-exit policy
18. Migration Watch UK has proposed a possible post-exit policy should the UK vote to leave the EU. This would see the employment component of EU migration limited by work permits to skilled migrants, while family members and students would remain free to come.[32] The effect of cutting migration into lower-skilled employment would be to reduce net migration from the EU by about 4,300 a year (that is about half of the current 8,600 average net migration from the EU identified by the IPS 2004-2014). If we take the average figure for cross-border migration for 2004-2014 (7,300 a year) as our benchmark, this would mean a reduction in overall net migration from its current average of around 22,500 to just over 18,000. However, as a caution, this paper bases its estimate on the NRS assumption of a minimum of 5,000 net cross-border migration until 2039. This gives overall net migration of (15,200 + 5,000) 20,200. Subtracting 4,300 a year from this figure leaves overall net migration of just under 16,000 a year. This is above the assumption of 15,000 that the NRS estimates as necessary for population growth of 7% until 2039.
Public opinion
19. Opinion polls on Scottish attitudes to immigration have shown consistent majorities in favour of reducing immigration. An October 2013 YouGov survey of Scottish voters found that 58% of those asked supported reduced immigration to Scotland, while only 10% wanted it increased.[33] The next year, a Scotcen survey of 1,339 Scottish adults found that 62% wanted to see immigration reduced by a little or a lot, and only 9% wanted to see it increased.[34] By March 2015, a YouGov/BBC poll found that 64% of people in Scotland wanted immigration reduced or stopped completely. The figure in the same poll for Britain as a whole was 70%.[35] In April 2016, 61% of Scots surveyed in a YouGov poll felt immigration had been too high in the last ten years.[36]
20. Furthermore, recent polls show that attitudes in England and Scotland on the importance of immigration as an issue facing the country are similar. A December 2014 YouGov poll found that immigration was named as the top issue which voters across the UK wanted politicians to discuss as the General Election approached.[37] In Scotland, immigration came only second after the NHS. Although the salience of immigration as an issue for Scottish voters (38%) was well behind that for voters in the north (53%) and south (52%) of England, it was just one point behind London (39%) in issue importance, where voters also named the NHS as top. However, by February 2016, an Ipsos MORI found that identical proportions of those surveyed in Scotland (27%) and in the UK as a whole (27%) named immigration as the most important issue facing Britain.[38] For Scottish voters in the referendum, immigration was the second most important issue in helping them decide how to vote, only just behind the economy.[39]
21. As the Migration Observatory notes, Scotland saw a proportionately greater increase in its migrant population than any of the other nations of the UK between 2001 and 2011.[40] However, the desires of overwhelming majorities of those surveyed for net migration to be substantially cut are all the more striking given there are only around half as many migrants per head of population in Scotland when compared to England.
Conclusion
22. Following a possible vote to leave the EU the UK could seek to negotiate an outcome that restricted migration from Europe for employment purposes to those going into higher-skilled work, plus accompanying families. If this were done, it is estimated that net migration to Scotland would be just under 16,000 a year, which is above the migration assumption contained in the NRS’s principal population projection. To summarise, we arrived at this estimate by:
- Taking the average of net migration from the EU given in International Passenger Survey data for 2005-2014 of 8,600 per year.
- Assuming that the flow of non-EU migration to Scotland will remain unchanged at 9,000 a year, the annual average of the IPS figures for 2005-2014.
- Using ONS Local Area Migration Indicators data for mid-2004 until mid-2014 to calculate annual average net overseas migration to Scotland over ten years. This was 15,200 a year.
- Taking the assumption of the NRS that cross-border migration will be a minimum of 5,000 a year until 2039 (while keeping in mind that it averaged 7,300 a year from 2004-5 to 2013-14). The combined totals of figures in assumptions 3 and 4 give overall net migration to Scotland of (15,200 + 5,000) 20,200 a year at the minimum.
- Finally, we factor in a proposed post-exit restriction on EU migration into UK employment. This would limit migration from Europe for work purposes to those taking up higher-skilled employment, reducing average EU migration by around half. Subtracting half of 8,600, or 4,300, from 20,200 a year, annual net migration would stand at 15,900 a year.
23. The proposal to reduce net migration to Scotland by this amount is not disproportionate or unreasonable. HM Treasury noted in August 2014 that annual net immigration of 15,500 people per year is still equivalent to adding a city of the population of Dundee every ten years. It would not substantively affect population growth on the principal 2014-based projection. However, it would go some way to addressing the clear opposition of the majority of Scots to current levels of net migration.
Footnotes
- Scottish Parliament Information Centre, ‘The Impact of EU membership on Scotland’, 15/71, October 2015, URL: http://www.scottish.parliament.uk/S4_EuropeanandExternalRelations… ct_of_EU_membership_in_Scotland.pdf
- ONS Local Area Migration Indicators for Scotland, mid-2004 to mid-2014, URL: http://www.ons.gov.uk/file?uri=/peoplepopulationandcommunity/popu… ionindicatorsaug15_tcm77-414816.xls
- See p. 32 of NRS ‘Projected population of Scotland, 2014-based’, October 2015, URL: http://www.nrscotland.gov.uk/files//statistics/population-projections/2014-based/pp14.pdf
- Ibid.
- National Records of Scotland, ‘Scotland’s Population: The Registrar Generals Annual Review of Demographic Trends, 2014’, August 2015, URL: http://www.nrscotland.gov.uk/files//statistics/rgar2014/rgar-14-corrected.pdf
- The dependency ratio in this context is the ratio between persons of retirement age per every 100 people of working age.
- Show 34 more...
- Scottish Parliament Information Centre, ‘The Impact of EU membership on Scotland’, 15/71, October 2015, URL: http://www.scottish.parliament.uk/S4_EuropeanandExternalRelations… ct_of_EU_membership_in_Scotland.pdf
- ONS Local Area Migration Indicators for Scotland, mid-2004 to mid-2014, URL: http://www.ons.gov.uk/file?uri=/peoplepopulationandcommunity/popu… ionindicatorsaug15_tcm77-414816.xls
- See p. 32 of NRS ‘Projected population of Scotland, 2014-based’, October 2015, URL: http://www.nrscotland.gov.uk/files//statistics/population-projections/2014-based/pp14.pdf
- Ibid.
- National Records of Scotland, ‘Scotland’s Population: The Registrar Generals Annual Review of Demographic Trends, 2014’, August 2015, URL: http://www.nrscotland.gov.uk/files//statistics/rgar2014/rgar-14-corrected.pdf
- The dependency ratio in this context is the ratio between persons of retirement age per every 100 people of working age.
- Oral evidence by Dr Katerina Lisenkova, National Institute of Economic and Social Research, House of Commons Scottish Affairs Committee, 27th April 2016, URL: http://data.parliament.uk/writtenevidence/committeeevidence.svc/e… ions-for-devolution/oral/33269.html
- Professor Michael Murphy, Population Insights, No. 3, April 2016, URL: http://www.population-europe.eu/file/1532/download?token=unkM8cyK
- Ibid.
- ONS, Annual mid-year population estimates mid-2013 to mid-2014, published April 2016, URL: https://www.ons.gov.uk/peoplepopulationandcommunity/populationand… dandwalesscotlandandnorthernireland
- Telegraph, , 29th October 2015, URL: http://www.telegraph.co.uk/news/uknews/immigration/11942613/Seven… know-about-migration-in-the-UK.html
- ONS, Local Area Migration Indicators, August 2015, URL: http://www.ons.gov.uk/peoplepopulationandcommunity/populationandm… reamigrationindicatorsunitedkingdom
- ONS, ‘Internal Migration, England and Wales for the year ending June 2014’, 25th June 2015, URL: http://www.ons.gov.uk/peoplepopulationandcommunity/populationandm… oritiesinenglandandwales/2015-06-25
- Telegraph, 29th October 2015.
- Telegraph. 23rd September 2015, URL: http://www.telegraph.co.uk/news/uknews/11885564/Northern-Ireland-… ndoners-suffer-from-inequality.html
- ONS,‘Internal Migration, England and Wales’.
- Migration Observatory, ‘Scotland – Census Profile’, 3rd December 2013, URL: http://www.migrationobservatory.ox.ac.uk/briefings/scotland-census-profile
- Scottish Parliament Information Centre, ‘The Impact of EU membership on Scotland’, 15/71, October 2015, URL: http://www.scottish.parliament.uk/S4_EuropeanandExternalRelations… ct_of_EU_membership_in_Scotland.pdf
- Migration Observatory, ‘Scotland – Census Profile’.
- SPIC, Impact of EU membership on Scotland’.
- ONS data released in response to parliamentary answer, June 2016, URL: http://www.parliament.uk/business/publications/written-questions-… -question/Commons/2016-06-03/39201/
- SPIC, Impact of EU membership on Scotland’.
- Quarterly Labour Force Survey, October-December 2015. Types of employment for EU migrants by year of first arrival in the UK 2005-2015 are broken down into nine categories, five of which (‘Category 4 - Administrative And Secretarial Occupations’, ‘Category 6 - Caring, Leisure And Other Service Occupations’, ‘Category 7 - Sales And Customer Service Occupations’, ‘Category 8 - Process, Plant And Machine Operatives’ and ‘Category 9 - Elementary Occupations’) are considered to be lower-skilled. The higher-skilled areas are ‘Category 1 -Managers, Directors And Senior Officials’, ‘Category 2 – Professional Occupations’, ‘Category 3 - Associate Professional And Technical Occupations 'and ‘Category 5 - 'Skilled Trades Occupations'. Out of an extrapolated figure of more than 107,000, just under 73,700 were estimated to be in lower-skilled work and around 33,600 were estimated to be in higher-skilled work.
- Scottish Government Social Research, ‘Characteristics and Intentions of Migrants to and Emigrants from Scotland – Review of Existing Evidence’, 2011, URL: http://www.gov.scot/resource/doc/340928/0113194.pdf
- NRS 2014-based population projection’
- See p. 25 of NRS 2014-based population projections.
- Scottish Government, ‘Purpose Target: Population’, last updated 30th April 2015, URL: http://www.gov.scot/About/Performance/scotPerforms/purposetargets/population
- NRS 2014-based population projection
- Institute for Fiscal Studies, ‘Fiscal Sustainability of an Independent Scotland’, November 2013, p. 13, URL: http://www.ifs.org.uk/comms/r88.pdf
- NRS 2014-based population projection.
- National Records of Scotland, ‘High Level Summary of Statistics: Population and migration’, August 2015, URL: http://www.nrscotland.gov.uk/files/statistics/high-level-summary/j11198/j1119813.htm
- Migration Watch UK, ‘UK immigration policy outside the EU’, 27th January 2016, URL: http://www.migrationwatchuk.org/briefing-paper/371
- October 2013 YouGov survey, URL: http://cdn.yougov.com/cumulus_uploads/document/5vbhf8v5ik/YG-Arch… ation-Observatory-EngWales-Scot.pdf
- Scotcen Survey 2014, URL: http://whatscotlandthinks.org/questions/do-you-think-the-number-o… tain-should-be-increased-remain-the
- YouGov/BBC Poll, March 2015, URL: https://d25d2506sfb94s.cloudfront.net/cumulus_uploads/document/pk… ults_Immigration_150306_Wesbite.pdf
- YouGov/ITV Poll, April 2016, URL: https://d25d2506sfb94s.cloudfront.net/cumulus_uploads/document/gr2aw4r8jf/ITNResults_160403_W.pdf
- YouGov poll, December 2014, URL: http://cdn.yougov.com/cumulus_uploads/document/x6ruhcrztv/Interna… ues_before_the_election_Website.pdf
- Ipsos MORI poll, February 2016, https://www.ipsos-mori.com/Assets/Docs/Polls/Feb16issuestabs.pdf
- City AM, 16th February 2016, URL: http://www.cityam.com/234714/eu-referendum-big-rise-in-those-who-… n-britain-as-a-whole-new-poll-finds-
- Migration Observatory, ‘Public opinion towards immigration in Scotland as it prepares for the referendum on independence’, February 2014, URL: http://www.migrationobservatory.ox.ac.uk/press-releases/public-op… it-prepares-referendum-independence